TI-83
Excel
Sketchpad
formulas
Stat Paper
Asides
e - a constant approximately equal
to 2.718281828454590, see below.

pi - - the ratio of the
circumference of a circle
to its diameter, about
3.14159 or 22/7.

      MAT123 Spring 2025 Notes


Mon, 3/31, 6.1, 6.2
6.1 The Standard Normal Distribution
a) Characteristics of the standard and non-standard normal distribution
b) Define and interpret z-scores
c) Apply Empirical Rule
6.2 Using the Normal Distribution
a) Sketch, shade and calculate probabilities
b) Find percentiles
c) Solve applied problems

Comments ...

I Wrote This A Feew Years Ago & Believe It Useful Now
Hi, fish
    It has material written for a nonmath individual who wishes to understand statistics.
    It is not a textbook, a more textbook-like presentation is on this page.
    New web material is at the bottom of this page but not on the video. "Normal and Standard Normal Distributions" in "A Year of Statistics in an Hour or Two"
  • Visit the web page
  • Listen to the video or parts of the video of this page,
    1:25:44 Normal and Standard Normal Distributions;
    1:25:44 vocabulary
    1:28:36 normal & standard normal scales, x, z, mean, standard deviation relationships
    1:34:37 use empirical rule to compute probabilities
    1:39:05 use web page to compute z or x score
    1:41:02 use the tables to compute probabilities
    1:44:09 standard normal distribution table
    1:45:35 If you want a symmetric shaded area centered on the mean in which half the area is above the mean and half the area is below the mean what z-score is needed?
  • asquared at MCC
  • Read the pdf file
  • Use the stat.xls -- spread sheet from the video
  • Use the local video
    Stay safe, A2

Some Characteristics of a Distribution
  • The graph of the probability density curve/function has a horizontal axis which is an x-axis, mu-axis, z-axis,
     
  • The graph of the probability density curve/function has a vertical axis of the probabilty of the x, the mu, the z-score.
     
  • The area under the curve, the probability, the sum of probabilities of every event equals 1.
     
  • OFTEN the mean is the "center" of the horizontal axis. (shown here with a normal distribution)
     
  • OFTEN the scale on the horizontal axis has as its unit of measure the standard deviation, the average difference between each score and the mean computed in the standard way.
  • WITHIN A SPECIFIC STANDARD DEVIATION OF THE MEAN - a range of scores centered about the mean and, in either direction, not farther on the number line than the specified number of standard deviations.
  • ANY DISTRIBUTION
    CHEBYCHEV'S RULES -- for any distribution, the percent of scores within k standard deviations of the mean, k > 0, is 1/k2


Characteristics of a Normal Distribution and the Standard Normal Distribution
  • BELL-SHAPED CURVE - It looks like a symmetric bell
    sitting on a table. The scores are piled in the center and
    trail off at the upper and lower range of variables.
  • a continuous probability distribution
  • mean = mode = median, the data gathers about a center
    making a symmetric bell-shaped curve.
  • Many uses -- heights of people, lengths of fish,
    errors measurements, standardized test scores have normal distributions.
  • With ANY normal distribution, the data spreads in a certain way.
     
    The Empirical Rule, often called the 68-95-99.7 rule is summarized in the figure at the left where X is a normal distribution random variable,
     
    Ex. with a normal distribution, "within 3 standard deviation of the mean" means, from -3 to 3, - 3 < x < 3, and includes about 99.7% of the scores.
  • z - the variable used to indicate workis with the standard normal distribution having
    a mean of 0 and
    a standard deviation of 1.
Compute x or z
 
To complete the computation
Enter negative two as "-2."
1st: Enter values
2nd: Press the buttons.
Compute z
z = [ - ] /
is  

Compute x  
x = + () ()
 
is  


Computational Tools for the Normal and Standard Normal Distributions
  • STANDARD NORMAL TABLE OF PERCENTS/PROBABILITIES - uses z-scores and their probabilities. (above center)
     
  • CUMULATIVE STANDARD NORMAL DISTRIBUTION - uses z-scores and their probabilities beginning with
    z=-3 and ending with z= 3, but, lists the sum of the probabilities from
    z = -3 to the desired z-score. (above right)
     
  • stat123sp25.A.xls - basic 1-variable & 2-variable statistics, scatterplot, regression
    stat.xls -- spread sheet from the video Area Under Curve Spread Sheet Commands Summary
    use NORMSDIST(z)
    Returns the standard normal cumulative distribution (has a mean of zero and a standard deviation of one).
    use NORMSINV(probability)
    Returns the inverse of the standard normal cumulative distribution (has a mean of zero and a standard deviation of one).
    use PROB(x_range,prob_range,lower_limit.Upper_limit)
    Returns the probability that values in a range are between two limits or equal to a lower limit.
     
    Area Under the Curve
    The Probability a Score is Below a Score, Above a Score, or Between Two Scores
    The area below a score is p(x < a) and is computed with:
            =NORMDIST(a,mean,standard deviation,true)
    The area above a score is p(x > a) and is computed with:
            =1-NORMDIST(a,mean,standard deviation,true)or
            =NORMDIST(a,mean, standard deviation,false)
    The area between two score is p(b < x < a) and is computed with:
            =NORMDIST(a,mean, standard deviation,true) -
            NORMDIST(b,mean,standard deviation,true)

  •  
  • sheet 6b of ReimannSums.gsp
    -- cummulative probability distribution w/32 Reimann boxes and input a and b,
    from page 
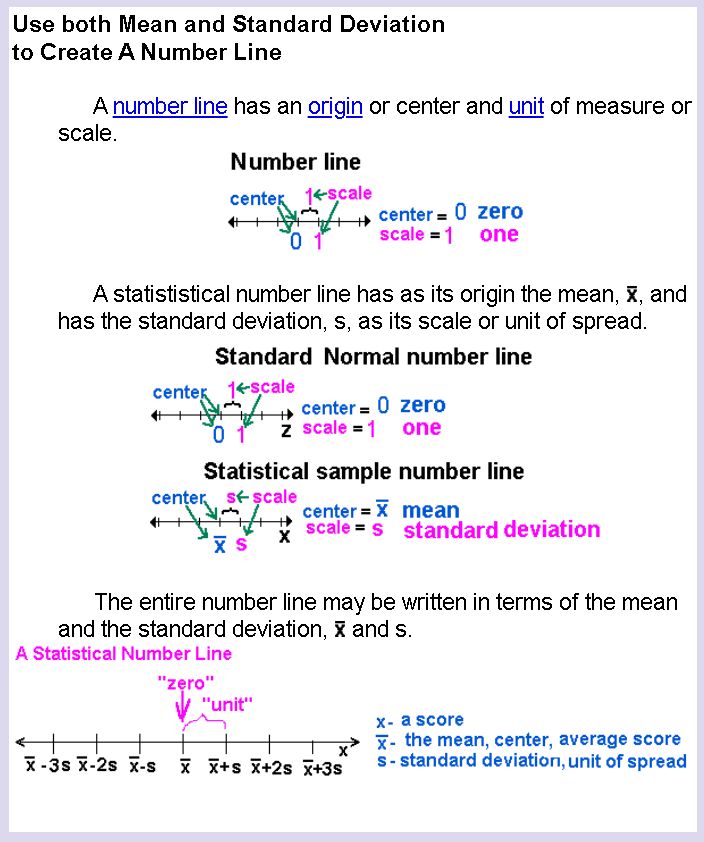
Mon, 2/3, in text book 2.5, 2.6, 2.7, "Center & Spread"
     
  •   TI83-84 STATISTICS and DISTRIBUTION Menu
    TI DISTRIBUTION PAGE
    1:normalpdf(x[,mean,standard deviation])
    normal probability density function
    2:normalcdf(lower bound,upper bound[,mean, standard deviation])
    normal cumulative distribution function (area under the curve)
    3:invNorm(area[,mean,standard deviation])
    normal distribution s x-value or z-score corresponding to a known area
  • omnicalculator.com/statistics/normal-distribution   notes


stanine -- standard nine


    Grading & Cheating Policy


[MC,i. Home, site home page] [MC,i. Home, site home page] math.htm STAT.23sp25 fish 83.stat.instructions algebra.notes [Words] spread sheet notes asquared at MCC Classes [Table] [MC,i. Home, site home page]
© 4/7/2025, A2, Agnes Azzolino mathnstuff.com/math/stat/23sp25.17.htm