Mon, 2/3, 2.5, 2.6, 2.7
- 2.5 Measures of the Center of the Data
- a) Distinguish notations for population and sample statistics
- b) Discuss Law of Large Numbers
- 2.6 Skewness and the Mean, Median, and Mode
- a) Discuss symmetry and skewness in data
- 2.7 Measures of the Spread of the Data
- a) Use software to calculate and interpret measures of dispersion (Lab 2)
- b) Calculate z-scores for data
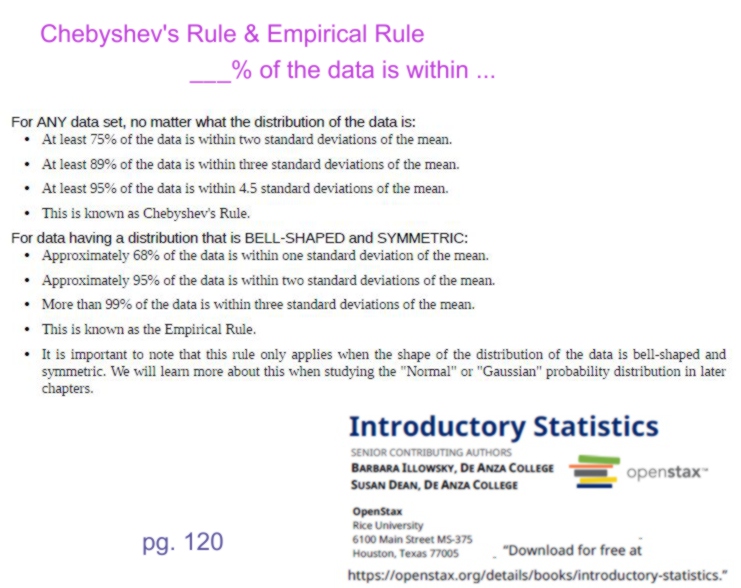
- c) Apply the Empirical Rule and Chebyshev’s Inequality to data 3
|
 Comments ...
Center & Spread - Hi,
- From a middle school introduction to statistics, a student is coached on the computation of an average, mean, mode, and median as a measures of the center.
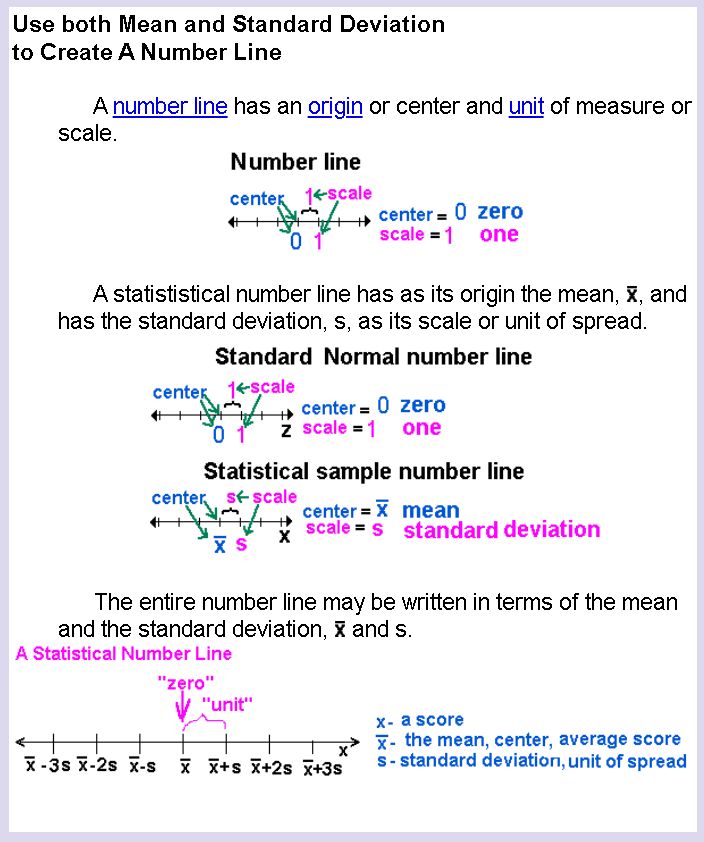
- Now consider an average as "a one number representation" of the entire sample or population.
- In middle school, range was the measure of how the set of numbers spreads out -- the difference between the highest and lowest -- a difference of the most extreme data points.
- In more recent years, middle school statistics focused more on discrete data representation -- quartiles, inner quartile range.
- Now consider spread in more specific ways. Here's a
pdf of this "page" or view the
video of "Center & Spread" , and a
Basic TI83/84 Calculator Use Video
- Go with confidence. Stay safe, A2
| |
|


 , read as "x bar" - arithmetic average.
  , read as "x hat" --median, Q2, the 50th percentile, the middle data point when the data is ordered
from lowest to highest
, read as "x hat" --median, Q2, the 50th percentile, the middle data point when the data is ordered
from lowest to highest