TI-83
Excel
Sketchpad
formulas

      MAT123 Spring 2025 Notes


Wed, 3/5, 4.1, 4.2
4.1 Probability Distribution Function for a Discrete Random Variable
a) Identify the characteristics of a discrete probability function
4.2 Mean or Expected Value and Standard Deviation
a) Calculate and interpret the expected value of a discrete random variable

Comments ...

asquared at MCC
Have A Lovely Semester Break!
Hi,
    Lab of February 7, 2025 is due before semester break, if possible,
    Nothing else due.
    "See" you" on Monday March 17, 2025. Happy St. Patrick's Day.
    Stay safe, A2

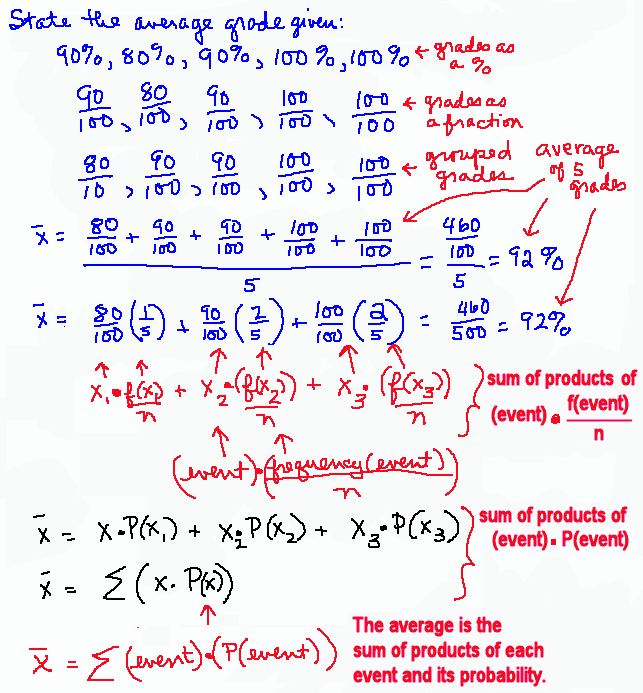
The average is the sum of the products of the event and the probability of the event.
 
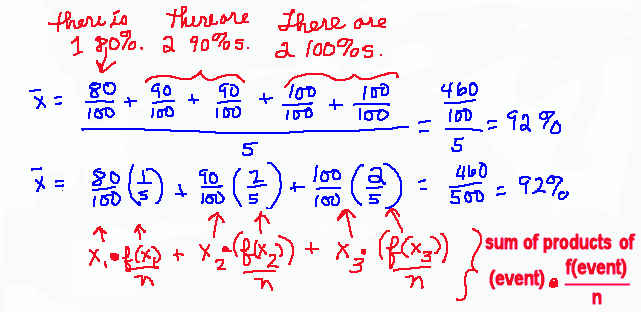
      In the example below, the task is to compute the average of test grades. These steps were chosen to complete the task, but, also to illustrate where the definition of the average as the sum of the products of the event and its probability is related to work already familiar to the reader.
 
 
      The most important work focuses on the fact that rather than add individual terms, the terms may be grouped by frequency.
 
 
      When the frequency is divided by the number of things to be averaged, a probability is obtained. The probability of an event is the frequency divided by the number of events in the sample space, P(event) = f/n.
 
      This definition of average, or expected value, may seem of little value here, but, the number in the sample space, the number of tests to be averaged, is only 5. Sometimes the size of the sample space is very large. Sometimes the size of the sample space is not given. Yet, the average or expected value of a probability distribution may be computed using the formula, sum of the products of the event and the probability of the event.
 
 
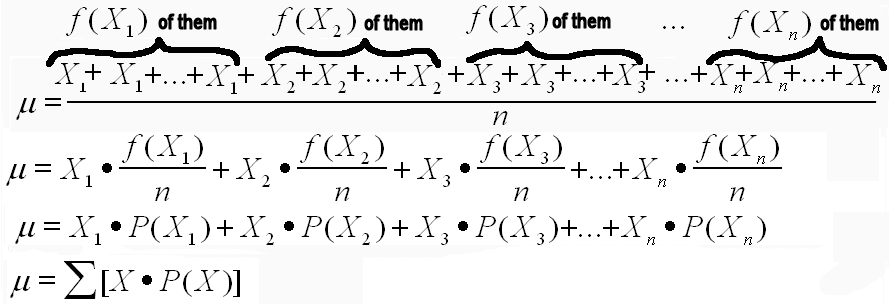
Why the mean, expected value, is (p)(n)
 
      What follows is the formal justification of the formula for the mean given above -- the mean, expected value, is the sum of the products of the event and the probability of the event.
A Binomial Distribution, Brief Summary
 
      Flip a coin 4 times (or flip 4 coins) and count the number of heads. The coin doesn't even need to be a fair coin (in which a tail is as likely as a head). The experiment is described by a binomial distribution.
 
      An only two-possible-outcome experiment, repeated a certain number of independent times is called binomial. The distribution or function has as a variable x, the number of successes. The other required parameters are n, the number of independent trials, and p, the probability of success. The probability of failure on each trial is q, or 1 - p.
      The mean and standard deviation of a BINOMIAL DISTRIBUTION are stated below.
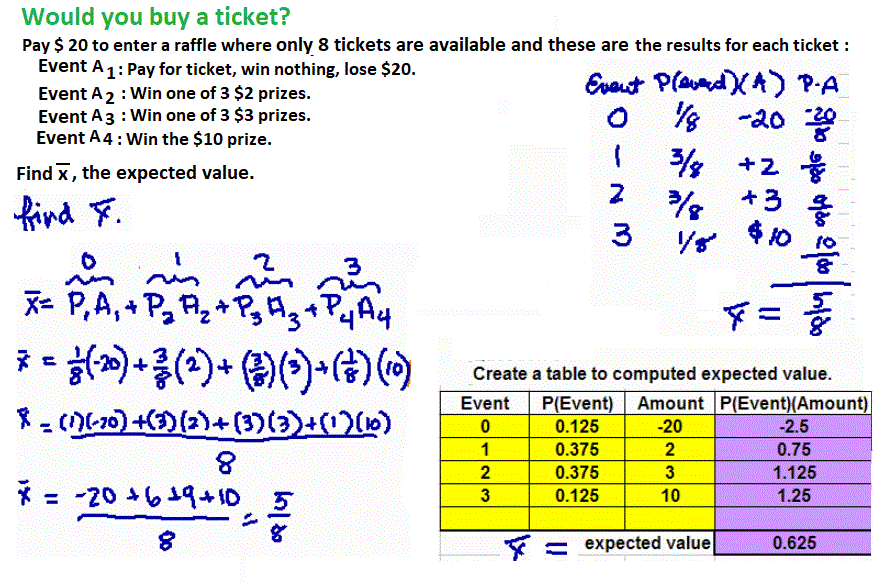
Would You Buy A $20 Raffle Ticket?

      The average is the expected outcome. The mean is the expected outcome.   In the raffle shown below, there is no prize worth that amount. The expected outcome of the raffle is to win $ 0.625, to win 62 1/2 cents, and there is no such prize, so, one just loses the $20.


[MC,i. Home, site home page]  [MC,i. Home, site home page] math.htm fish 83.stat.instructions algebra.notes [Words] spread sheet notes asquared at MCC Classes [Table] [MC,i. Home, site home page]
© 3/24/2025, A2, Agnes Azzolino mathnstuff.com/math/stat/23sp25.12.htm