Class Table library

  Function and Relation Library
Curve Shifting because of Addition & Subtraction

Two Shifts Presented through An Example:
      y = (x-2)² - 4

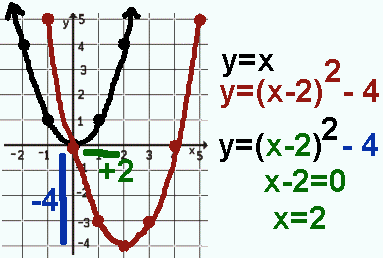
    The squaring function, y = x², drawn here in black, is a parabola. It determines what is done to numbers and therefore the shape of the curve.

    The function in brown, named only by the equation y = (x -2)² - 4, is also a parabola, but is shifted from x² in two ways by two components of the function.


"Domain Shift"

      The first shift occurs because the value of the number is decreased before it is squared. This DECREASE in the x-values cause the y-values, the values of the function, and therefore the curve, to move to the RIGHT. [An INCREASE in the x-values would have caused the y-values, the values of the function, and therefore the curve, to move to the LEFT.]

      The vertex shifts. The axis of symmetry shifts. The entire curve shifts. The values of the function stay the same. All this is because of the effect the decrease had on the numbers before they were squared.


"Domain Shift" Again

      But WHY does a "DECREASE in the x-value cause the function, and therefore the curve, to move to the RIGHT?"

      In the function y=(x-2)², x² is shifted to the right.

      In the function y=(x+2)², x² is shifted to the left.

      All this happens because the value that is squared -- the value the squaring function uses as its input or domain -- is what determines the value that is output, the function value, the y-value.

      Recall that a function is a really dependable rule.

      Look above and see that when you square 0, you get 0, when you square -1 you get 1, when you square 1 you get 1, when you square 2 you get 4, and so on -- the usual ..., 9, 4, 1, 0, 1, 4, 9, ... pattern in the output or function or y-values.

      Look below and see how INCREASING the x by 2 before squaring moves the numbers to be squared to LEFT and DECREASING the x by 2 before squaring moves the numbers to be squared to the RIGHT.

      Look for the zeros to see how clearly this shift is visible.

      Shortly, the last long animation on this page shows the composition and how the domain and the range shifts work.  Understanding composition of functions is really important.


"Range Shift"

      The second shift occurs because the value of the function are decreased after the numbers are squared. This change, the -4 of x² - 4, literally says "take the square of the number and decrease it by 4." It means every square must be decreased so, the curve moves down 4.


"Both Shift" Restated with More Detail
y = (x - 2)² - 4

    The graph of y = (x - 2)² - 4 depicts a function which takes a number, decreases it by 2, squares that, decreases that by 4.

    There is a "domain shift" forced by the x - 2. It positions the curve to the right 2 units. Notice how the axis of symmetry has changed from x=0 for x² to x=2 for (x - 2)².

    There is a "range shift" forced by the - 4. It positions the curve down 4 units.

    RELOAD the page with the browser to start the animation from the beginning.

      Again: In the curve y = (x - 2)² - 4, the squaring, symbolized by 1()² gives the curve its shape and dilation. The (x-2) "recenters" the curve horizontally from a axis of symmetry of x=0 to an axis of symmetry of x-2=0 or x=2. The - 4 "shifts" the curve down 4.

    Here, one last time in animation format, is the graphing of y = (x - 2)² - 4 from a composition of functions standpoint.


More Stuff

    Visit Graphing Quadratics for more examples and problems on curve shifting.

    For more on how functions are created see Composition of Functions.


[MC,i. Home] [Table] [Words] Classes [this semester's schedule w/links] [Good Stuff -- free & valuable resources]
© 2007, Agnes Azzolino
www.mathnstuff.com/math/spoken/here/2class/300/fx/shift.htm